How bilingual is Queens?
by Tomonori Nagano
tnagano@lagcc.cuny.edu
ABOUT THE AUTHOR
Tomonori Nagano
Dr. Tomonori Nagano is an Associate Professor of Japanese and Linguistics, he started teaching at LaGuardia in 2008. Tomonori received his Ph.D. and M.Phil. in Linguistics from the CUNY Graduate Center and his MA in TESOL from New York University. He is currently serving as the coordinator for the Modern Langauges and Literatures Program at LaGuardia Community College.
Downloads: manuscript (pdf, 696K)
Bilingualism is deeply interwoven into the identity of New York City. Known as the world's most famous immigration hub, New York City represents an unparalleled level of ethnic, cultural, and linguistic diversity that few places in the world have. As Tonnelat and Kornblum (2017) note, one good place to observe dynamic language practices in New York City is the 7 train, which runs through Eastern Queens to West Manhattan. Sitting on a seat with eyes closed, we can listen to a whole range of different languages spoken in the city, from Mandarin and Korean near Flushing, to a range of Spanish dialects near Junction Blvd, a melangé of South Asian languages at Roosevelt Ave, and a group of languages spoken in small communities such as Portuguese, Greek, Arabic, and Japanese at Queensboro Plaza. Finally, additional languages spoken by tourists contribute to this tremendous level of linguistic diversity on the 7 train after the East River into Manhattan.
It is probably well-known that the U.S. as a whole is gradually becoming a bilingual nation. The number of bilingual speakers has steeply increased after the passage of the Hart-Celler Immigration Act of 1965, which eliminated the national-origins quota for U.S. immigration and opened the door to people in non-Western nations such as South America, Asia, and Africa (Hugo-Lopez, Passel, & Rohal, 2015). It is safe to say that the current bilingual capacity in the U.S. owes a lot to the influx of immigrants after 1965. According to the American Community Survey in 2015 (Gambino, 2018), 65.5 million or about 20% of people in the U.S. speak languages other than English at home. Also, my own study (Nagano, 2015) shows that the number of heritage language speakers (those who speak English as the primary language and speak an additional language at home, typically second-generation immigrants born to parents speaking minority languages) has also increased by leaps and bounds from 13.9 million speakers in 1980 to 28.7 million speakers in 2010.
| Year | # of HL speakers |
|---|---|
| 1980 | 14,083,320 |
| 1990 | 18,736,328 |
| 2000 | 24,404,745 |
| 2010 | 28,713,690 |
Table 1: The Numbers of HL Speakers in the U.S. in 1980, 1990, 2000, and 2010 (adapted from Nagano, 2015)
While the increase of bilingual speakers is frequently discussed, it is less well-known that we are also witnessing an unprecedented level of expansion in the number of languages spoken in the U.S. The previous patterns of bilingualism in the U.S. tend to be associated with mass migration from a specific region or a small number of ethnic communities such as Irish mass immigration in the 1830's – 1840's, immigration from Southern and Eastern Europe in the 1880's, and immigration from Latin America in the late 20th century. As a consequence, bilingual speakers in the past spoke a relatively small set of languages in the U.S. such as German, French, Italian, Polish, Russian, and Spanish. What we have been witnessing in the past few decades is, however, a large number of languages spoken by relatively small numbers of people.
A comparison of the U.S. census data between 1980 and 2010 (Nagano, 2015) can illustrate this fact. As mentioned above, the total number of heritage speakers increased from 13.9 million speakers to 28.7 speakers (an increase by 107%) between 1980 and 2010. The table below shows languages that increased in number of speakers at more than the average rate. For example, Spanish, which is by far the largest heritage language group, shows a growth of 163%. However, Spanish is not among the languages that show the fastest growth. In fact, nearly a half of contemporary bilingual speakers in the U.S. speak languages other than Spanish, including languages that were barely attested in 1980 (such as Dravidian languages, Amharic and other Ethiopian languages, and Tibetan).
| Language | 1980 | 2010 | Increase |
|---|---|---|---|
| Dravidian | 26,900 | 423,649 | 1475% |
| Amharic, Ethiopian, etc. | 8,180 | 108,221 | 1223% |
| Tibetan | 5,880 | 75,687 | 1187% |
| Albanian | 7,000 | 77,777 | 1011% |
| SubSaharan Africa | 35,820 | 335,973 | 838% |
| Indonesian | 11,040 | 97,439 | 783% |
| Other ES Asian | 8,760 | 67,401 | 669% |
| Hindi and related | 163,760 | 1,185,354 | 624% |
| Russian | 88,000 | 481,380 | 447% |
| Vietnamese | 113,800 | 540,677 | 375% |
| Rumanian | 20,140 | 76,918 | 282% |
| Turkish | 18,460 | 66,476 | 260% |
| Chinese | 375,800 | 1,233,957 | 228% |
| Arabic | 146,140 | 439,744 | 201% |
| Spanish | 6,465,280 | 17,013,399 | 163% |
| Korean | 187,700 | 487,432 | 160% |
| Filipino, Tagalog | 354,800 | 789,915 | 123% |
| ALL | 13,869,680 | 28,713,690 | 107% |
Table 2: The Numbers and Increase Rates of HL Speakers by Language in 1980 and 2010 (adapted from Nagano, 2015)
What we see on the 7 train is an epitome of this unprecedented level of linguistic diversity in Queens, which is the host of many of these new languages in the U.S. For example, a Tibetan community in Jackson Heights is one of the few ethnic enclaves for Tibetan speakers in the U.S. that have emerged since 1965. In order to visually illustrate these linguistic enclaves of less commonly spoken languages in Queens, I have represented different languages spoken in each of Queens community district (see the following links for the language maps for Manhattan [https://bit.ly/3mBtkwG], Bronx [https://bit.ly/3a263Py], and Brooklyn [https://bit.ly/3uKOdIv]).
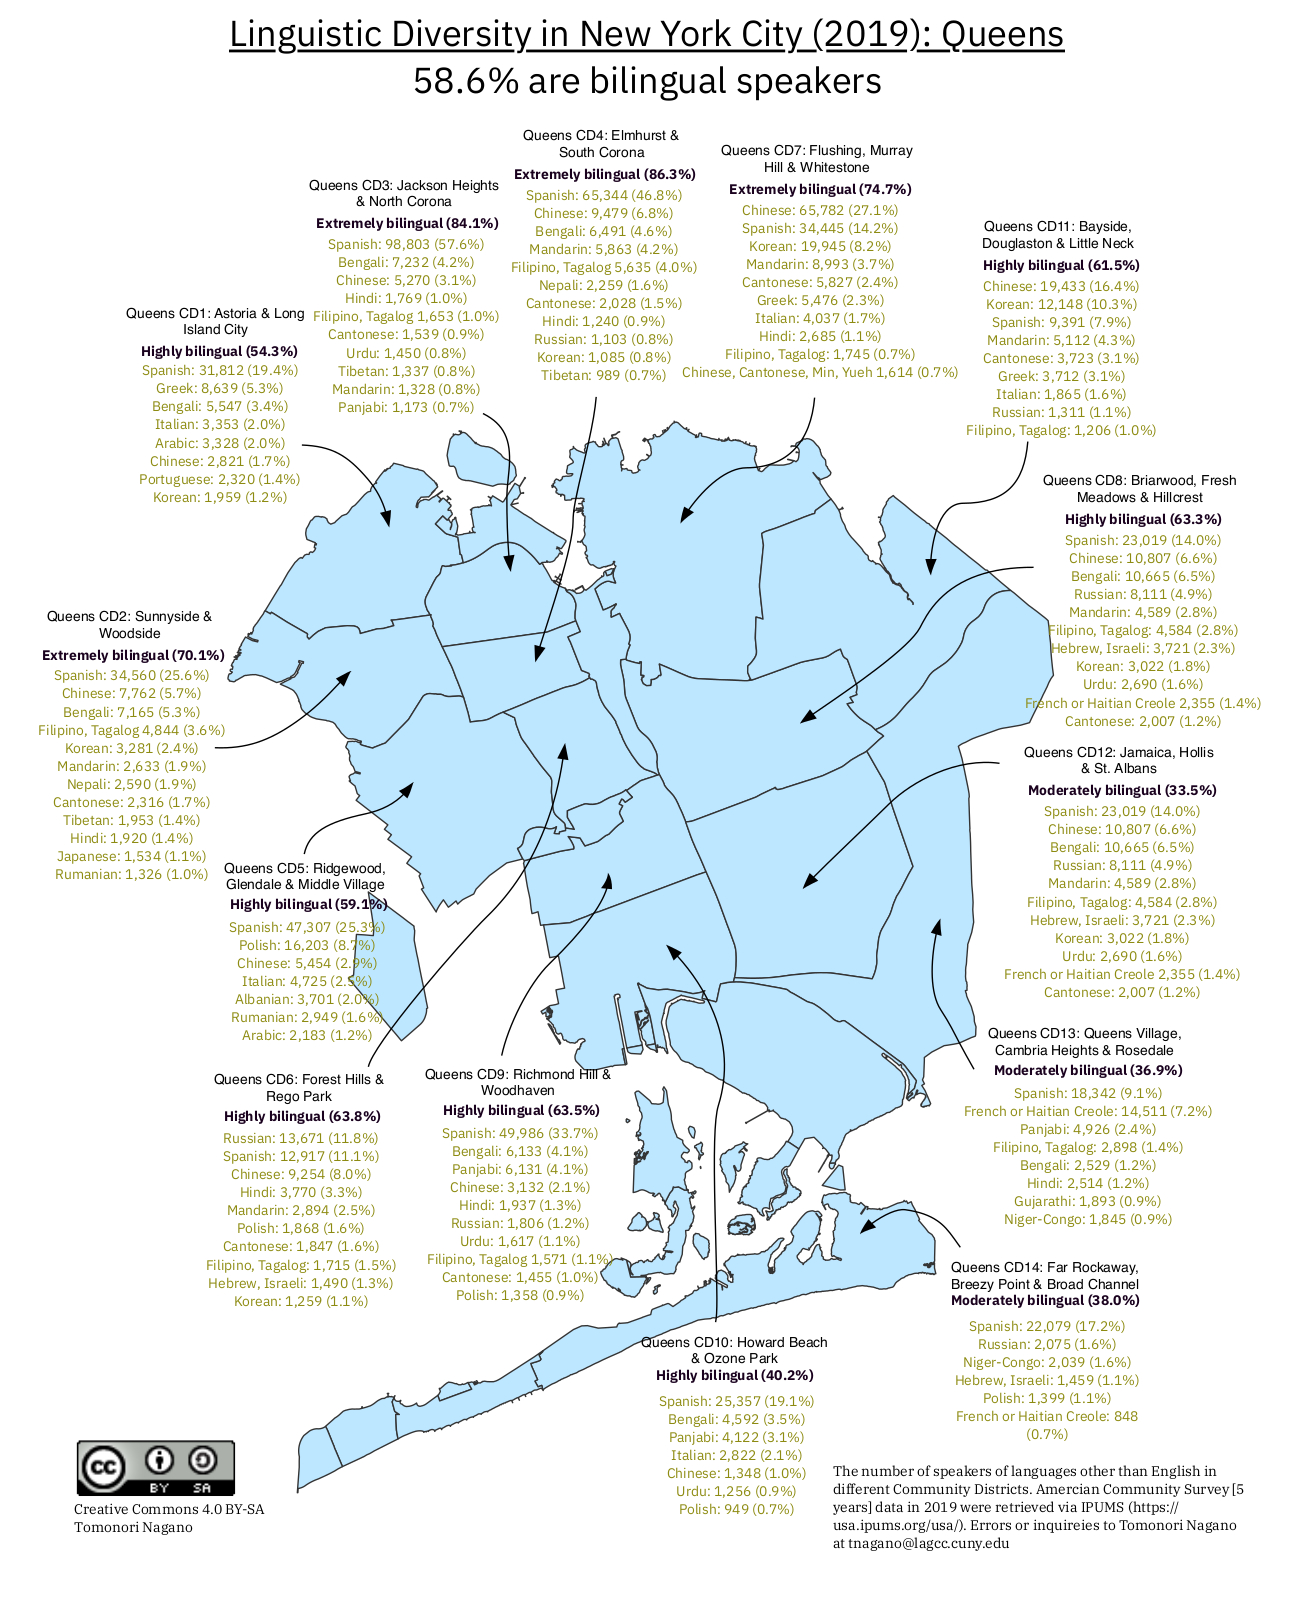
Figure 1: Linguistic Diversity Map of Queens (The number of speakers of languages other than English in different Community Districts. American Community Survey [5 years] data in 2019 were retrieved via IPUMS (https://usa.ipums.org/usa/). PDF version at https://bit.ly/3wJwkf9).
The map shows extremely rich linguistic communities in the immediate neighborhood of LaGuardia Community College, including such languages as Arabic (Astoria/Long Island & Ridgewood, Glendale/Middle Village), Bengali (Jamaica, Hollis/St. Albans & Briarwood, Fresh Meadows/Hillcrest), Chinese (Mandarin, Cantonese, Min, Yueh) (Flushing, Murray Hill/Whitestone & Bayside, Douglaston/Little Neck), Filipino (Tagalog) (Elmhurst/South Corona & Sunnyside/Woodside), French or Haitian Creole (Queens Village, Cambria Heights/Rosedale & Jamaica, Hollis/St. Albans), Hindi/Urdu (Forest Hills/Rego Park & Jamaica, Hollis/St. Albans), Italian (Ridgewood, Glendale/Middle Village & Flushing, Murray Hill/Whitestone), Japanese (Sunnyside/Woodside), Korean (Flushing, Murray Hill/Whitestone & Bayside, Douglaston/Little Neck), Nepali (Sunnyside/Woodside & Elmhurst/South Corona), Polish (Ridgewood, Glendale/Middle Village), Russian (Forest Hills/Rego Park), and Tibetan (Sunnyside/Woodside & Jackson Heights/North Corona).
When you take the 7 train next time, close your eyes and try listening to this astounding collection of language that cannot be seen anywhere else in the world.
Resources to learn more about linguistic diversity in Queens and NYC
Clayman, Chris & Lee, Meredith (2010). ethNYcity: The Nations, Tongues, and Faiths of Metropolitan New York. New York, NY: Metro New York Baptist Association.
Foner, Nancy Foner, N. (Ed.), (2013). One Out of Three: Immigrant New York in the Twenty-First Century. New York, NY: Columbia University Press.
Funk, A. (2012). The Languages of New York State: A CUNY-NYSIEB Guide for Educators. The CUNY-NYSIEB.
Gallaudet Research Institute (2011). Regional and National Summary Report of Data from the 2009-10 Annual Survey of Deaf and Hard of Hearing Children and Youth. Gallaudet University.
Garcia, Ofelia & Fishman, Joshua A. Garcia, O. & Fishman, J. A. (Eds.), (2011). The Multilingual Apple: Languages in New York City (2nd). New York, NY: Walter de Gruyter.
Lewis, P. M., Simons, G. F., & Fenning, C. (2015). Ethnologue: Languages of the United States. In P. M. Lewis, G. F. Simons, & C. Fenning (Eds.), Ethnologue. (pp. 18). Dallas, Texas: SIL.
Potowski, Kim (2010). Language diversity in the USA. Cambridge, Mass.: Cambridge University Press.
Tamasi, Susan & Antieau, Lamont (2014). Language and Linguistic Diversity in the US: An Introduction. New York, NY: Routledge.
References
Gambino, C. (2018). American community survey redesign of language-spoken-at-home data, 2016 (Working Paper No. SEHSD Working Paper Number 2018-31). Washington, D.C.: U.S. Census Bureau.
Hugo-Lopez, M., Passel, J., & Rohal, M. (2015). Modern immigration wave brings 59 million to U.S., driving population growth and change through 2065 (Tech. Rep.). Washington, D.C.: Pew Research Center.
Nagano, T. (2015). Demographics of adult heritage language speakers in the United States: Differences by region and language and their implications. The Modern Language Journal, 99(4), 771-792. doi: 10.1111/modl.12272
Tonnelat, S., & Kornblum, W. (2017). International express: New yorkers on the 7 train. New York, NY: Columbia University Press. (ELN101 (reference), Price: $14.60)